Blog
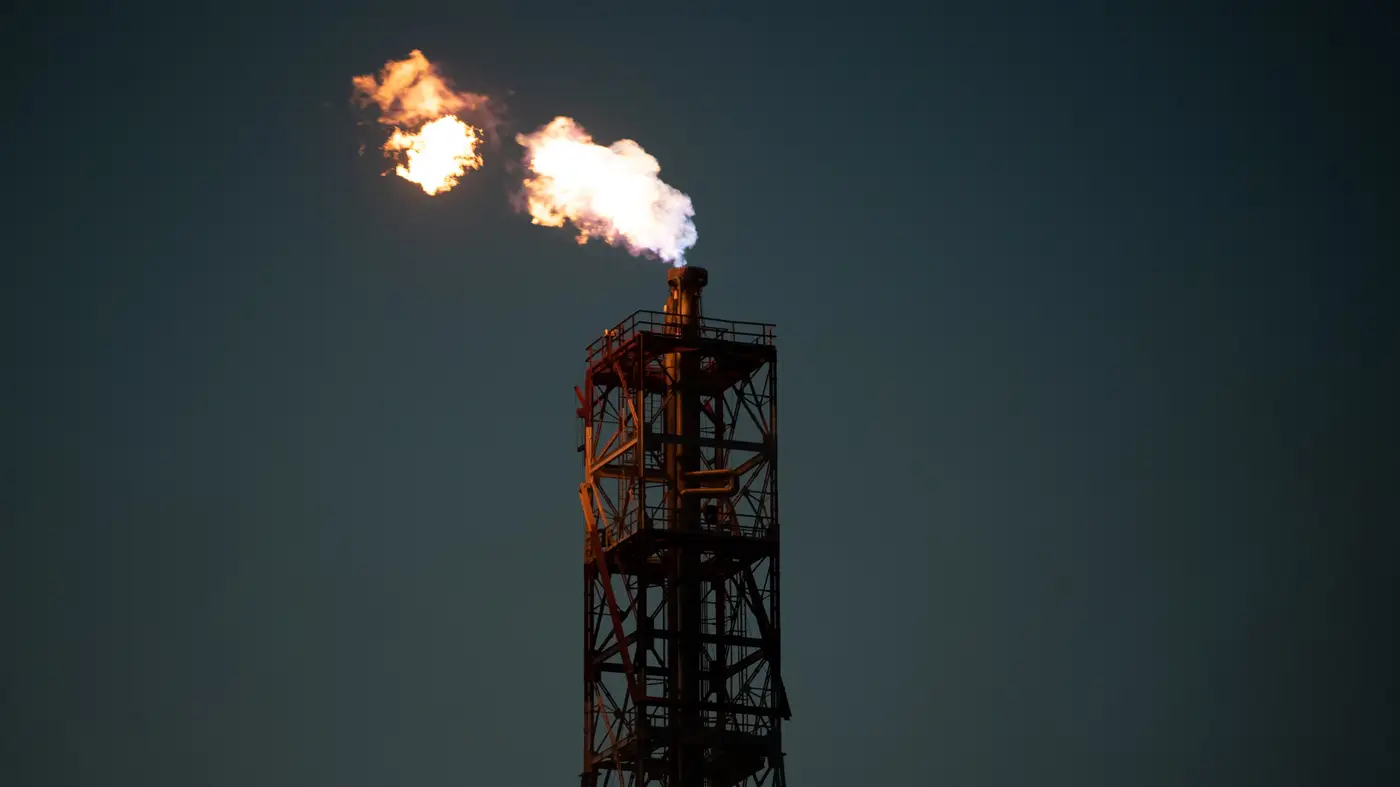 Field notes: the flare that only burned on weekends
A single stack that lit up Friday night and went dark Monday morning, and what that weekly pattern says about staffing gaps.
 What is MARS, and how does satellite flare data fit into it?
A look at UNEP's Methane Alert and Response System (MARS) and where nightly satellite flare data fits in emissions verification work.
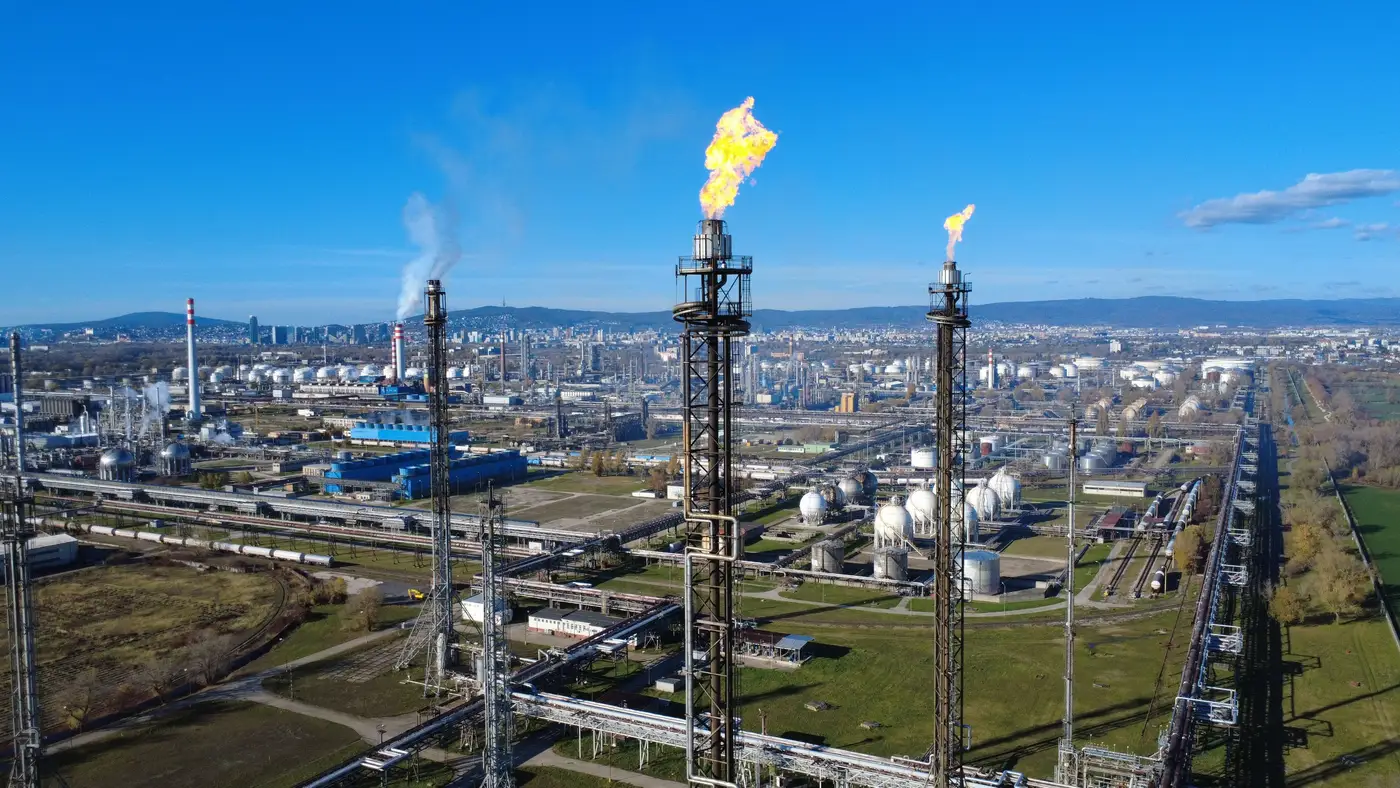 How to compare flaring trends across neighboring basins using nightly counts
How regulators and ESG analysts use nightly satellite flare counts to compare basin-to-basin flaring trends without relying on operator filings alone.
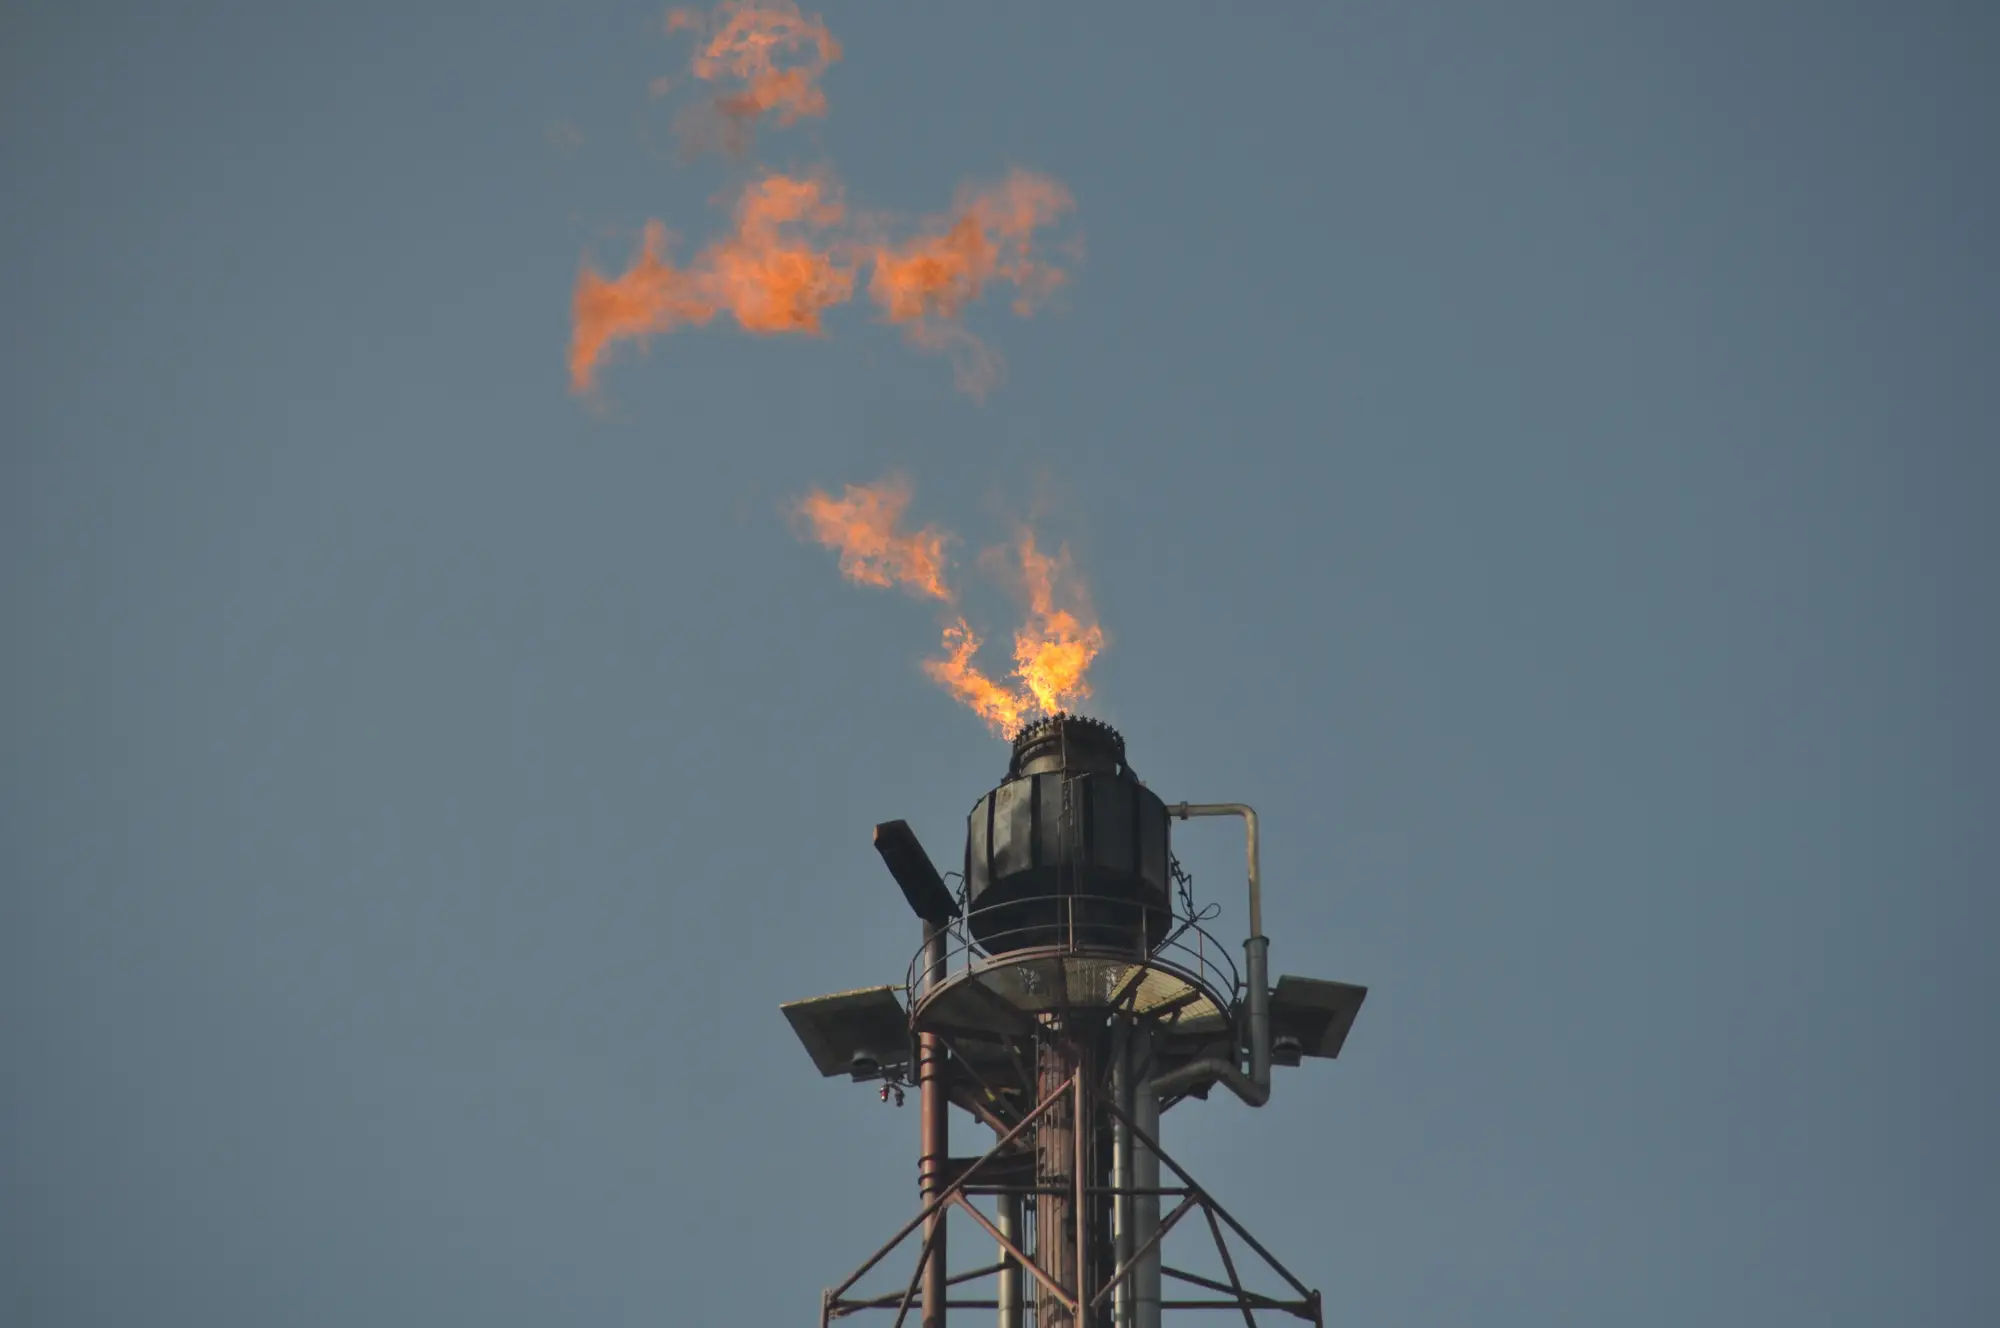 What is GGFR, and how do satellite counts feed its reporting?
A plain look at GGFR, the World Bank partnership behind global flaring estimates, and how satellite data feeds its annual numbers.
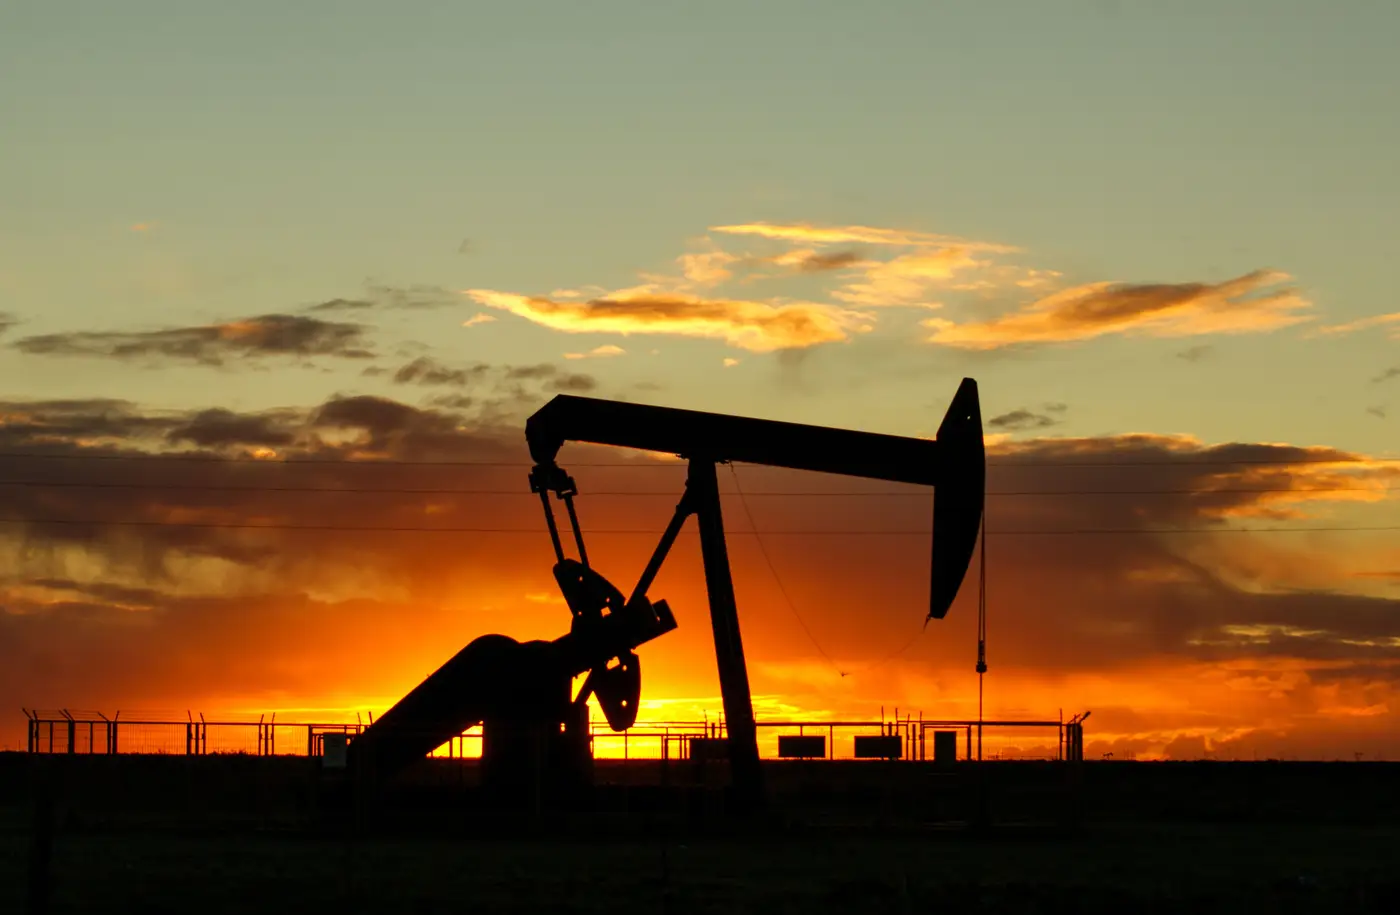 Field notes: the basin where flare counts kept climbing after the pledge
A basin signed the zero routine flaring commitment. The flare count went up anyway. Notes on reading the gap between pledge and practice.
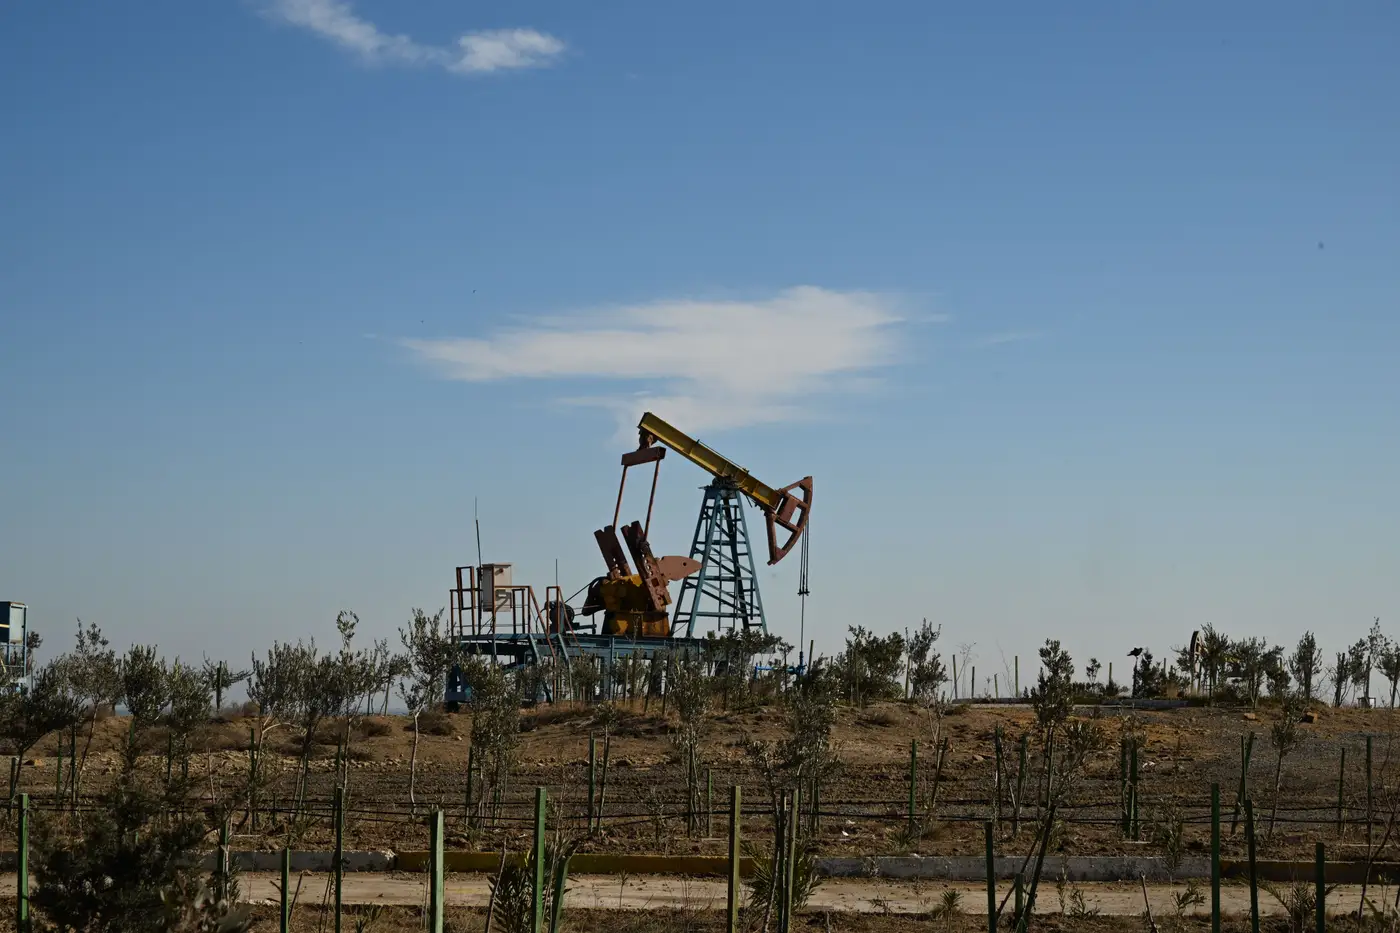 What is associated gas, and why does it get flared instead of sold?
Associated gas, gas-to-oil ratio, and stranded gas explained: why operators flare instead of selling, and what it means for reported volumes.
- What is a green completion, and how does it cut flaring during well testing?
A plain-language look at green completions and reduced emission completions, and why flowback gas capture changes what nightly flare data shows.
- What is the gas-to-oil ratio, and why it drives flaring
What the gas-to-oil ratio (GOR) is, why rising GOR pushes operators toward flaring, and how stranded gas economics drive the decision.
- Field notes: the night three flares lit up a basin that reported zero
A basin's quarterly filing said zero routine flaring. A nightly SWIR log showed three flares burning on and off for five weeks.
- How satellite flare counts stack up against Subpart W reporting
A look at what satellite-detected flare counts can and can't tell you alongside annual GHGRP Subpart W flaring volumes.
- VIIRS Nightfire vs. commercial satellite flare counts: what's the difference
How free VIIRS Nightfire flare data differs from a scoped commercial flare log, and which one fits a regulator or ESG analyst's actual workload.
- What is flaring intensity, and how is it calculated per barrel of oil equivalent?
A plain explanation of the flaring intensity ratio, how flared gas per BOE is calculated, and why the inputs are messier than the formula.
- How cloud cover affects nightly satellite flare counts
Why overcast nights blank out thermal passes, what a missed detection night means for a flare log, and how to read around the gaps.
- What is the difference between venting and flaring?
Venting vs flaring definition and why the gap between them matters for emissions reporting, Scope 1 accounting, and regulatory oversight.
- Estimating flare volume from flame size: what satellite imagery can and can't tell you
How analysts translate flare flame size and radiative power from night-time imagery into a rough volume proxy, and where the method breaks down.
- Operator self-reported flaring data vs. satellite-observed flare counts
Why operator flaring reports and satellite flare counts diverge, and how regulators and ESG analysts close the gap with independent monitoring.
- Routine flaring vs. non-routine flaring: what's the difference
A plain breakdown of routine vs. non-routine flaring: how the two get classified, why it matters for emissions reporting, and how to spot each from outside.
- What counts as a flare versus a well pad light in night-time imagery
How analysts tell a flare apart from pad lighting, rig lights, and other night-time sources, and where false positives creep into flare counts.