How satellite flare counts stack up against Subpart W reporting
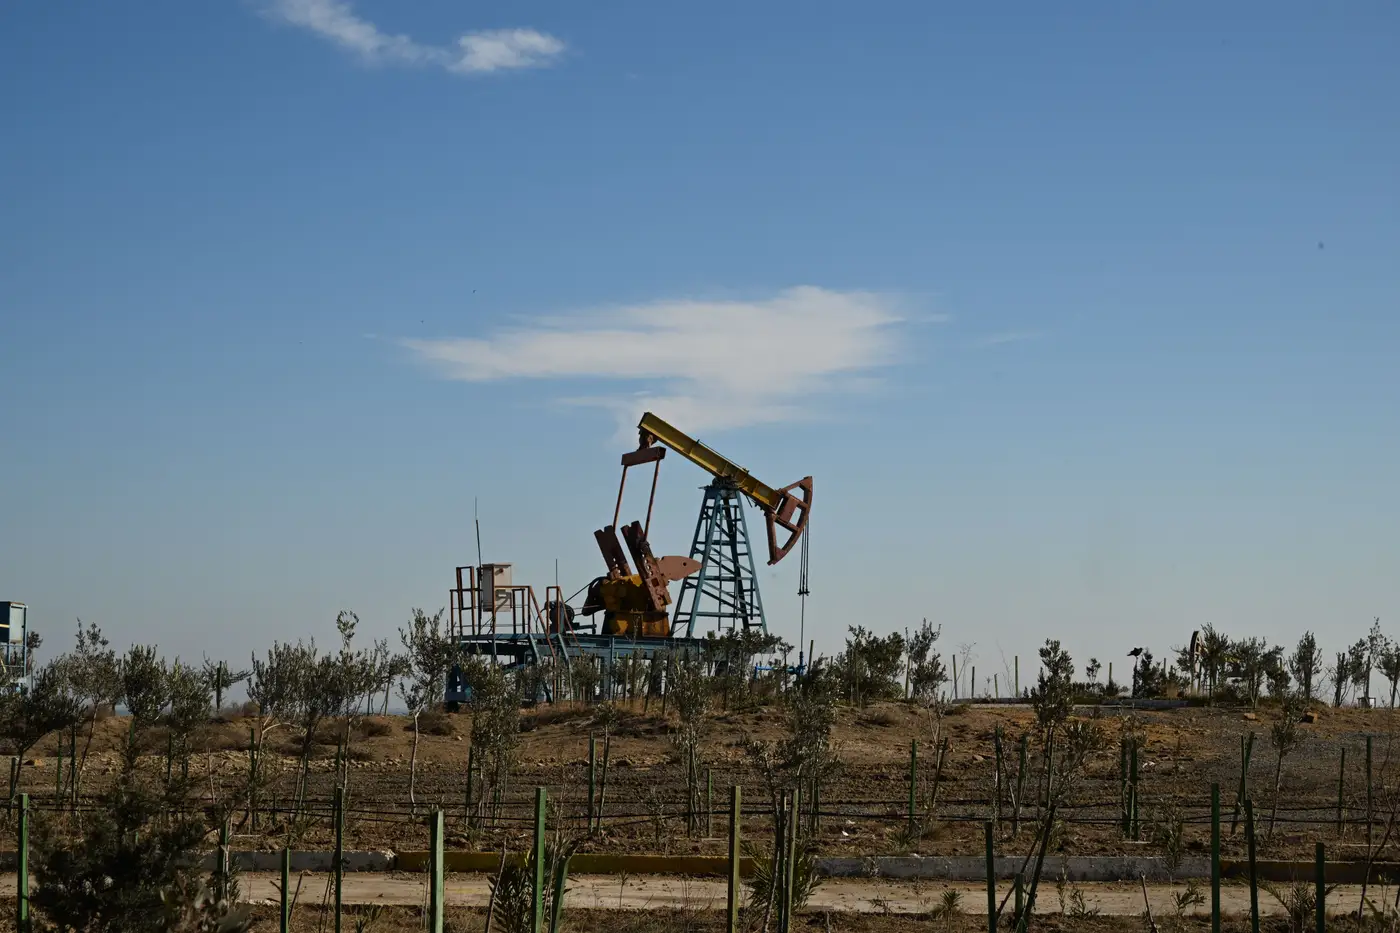
If you work with GHGRP data long enough, you start to notice the gap between what a facility reports once a year and what's actually burning off the stack on a given night. Subpart W asks operators to report flaring volumes using flare meters where installed, engineering calculations where they're not, or in a lot of cases, AVO monitoring: someone looking at the flare, listening to it, maybe smelling for incomplete combustion, and writing down whether it looked lit. That's the system. It's also why analysts and regulators keep asking whether satellite detections can serve as a check on it.
Satellite flare counts and Subpart W numbers measure different things, and treating them as interchangeable will get you in trouble in a filing or a fund memo.
What Subpart W captures
Subpart W flaring reporting is annual, facility-level, and expressed in volume terms, usually standard cubic feet of gas flared, which then gets converted to CO2e using combustion efficiency assumptions. A single number covers twelve months of operation across however many flare stacks a facility runs. If a flare was lit for three nights in March and ran continuously in August, that distinction disappears into one annual total. And because a meaningful share of flares are reported via engineering estimate or AVO rather than metered, the number carries assumptions baked in before it ever reaches a regulator's desk.
That's not a knock on operators. Metering every flare stack is expensive, and AVO has been an accepted method for years. But it means the reported volume is one operator's estimate of their own emissions, checked against nothing external in most jurisdictions.
What a nightly flare count adds
Night-time and SWIR satellite passes don't give you a volume. They give you a detection: was a flare burning at this location on this night, and roughly how large did the thermal signature read. Run that across a monitoring area over a full year and you get something Subpart W doesn't produce on its own, a flare-by-flare, night-by-night log of activity. Stack that against the annual self-report and a few things become visible that weren't before:
- A facility reporting minimal flaring that shows consistent nightly detections across most of the year.
- A reported volume that looks flat year over year while the detection count shows a clear seasonal pattern, suggesting the annual number is smoothing over real variation.
- A basin-wide trend where total detected flare-nights are climbing even as aggregate reported volumes stay steady, worth a closer look before the next filing cycle.
None of that tells you the exact MMBtu or ton of CO2e difference. What it gives you is a reason to ask a question, or a confirmation that the self-reported trend line matches what's happening on the ground. For an ESG analyst building a position or a regulator deciding where to send an inspector, that's often the more useful output than a precise volume estimate would be, because it's independent of the operator doing the counting.
Where the comparison breaks down
A few limits are worth stating plainly. Coarse-resolution thermal imagery can miss smaller flares, especially intermittent or low-volume ones, and detection confidence drops with cloud cover and atmospheric interference on any given night. Satellite counts also can't distinguish flaring from other high-heat sources with complete certainty without ground-truthing. And there's no fixed conversion from "flare detected, moderate size" to a specific volume figure. This is a corroboration tool, not a replacement for metered data, and anyone presenting it as a one-to-one audit of Subpart W numbers is overstating what the imagery does.
Used for what it is, though, a nightly detection log sitting alongside the annual GHGRP filing gives you a second, independent line of sight into flaring activity that doesn't depend on the facility's own instrumentation or its AVO observer's judgment call. A nightly flare log across your monitoring area is built for exactly that kind of cross-check, not as a substitute for the metered number but as a way to see what's happening between filing cycles.
If you're tracking flaring as a proxy for production or building out an emissions comparison across a portfolio, it's worth seeing what a nightly read looks like for your own area of interest.