How to compare flaring trends across neighboring basins using nightly counts
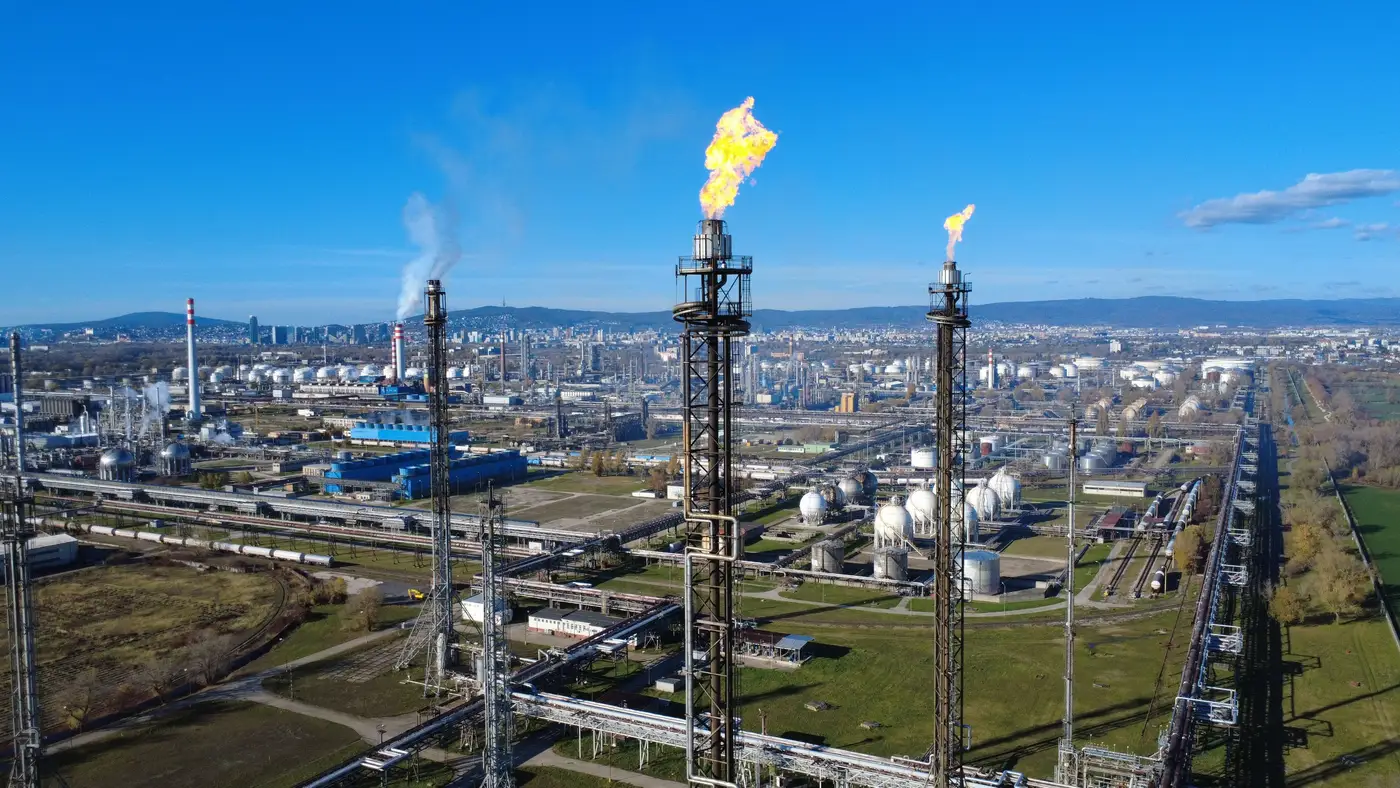
Two basins sitting next to each other can report wildly different flaring numbers to a state commission, and the gap often has more to do with how each operator fills out a form than with what's burning off the wellhead that week. If you're trying to benchmark flaring activity across the Permian versus the Bakken, or two counties inside the same play, operator self-reports give you a start date and an end date but not much you can trust for a month-to-month trend line. Nightly satellite counts fix that by giving every basin the same measurement stick on the same night.
Why basin comparisons break down with self-reported data
State filings for flaring volumes get submitted on different schedules, use different unit conventions, and in some jurisdictions only cover flares above a certain volume threshold. A basin with looser reporting rules looks cleaner on paper than one with stricter rules, even if the flare count on the ground is higher. ESG analysts building a regional emissions proxy run into this constantly: the operator with the best compliance department isn't necessarily the operator with the fewest flares.
A nightly satellite read sidesteps the reporting lag and the unit mismatch entirely. Night-time and SWIR imagery picks up the thermal signature of a flare whether or not anyone filed paperwork about it that week. That gives you one consistent data source across basin boundaries, which is the actual prerequisite for a fair comparison.
Building a basin-level flare log from nightly counts
A basin-level flare log is just a running tally: how many flare detections showed up in a given monitoring area each night, and roughly how large each one read. Once you have that log running for two or more basins over the same stretch of weeks, you can start asking questions a self-reported dataset can't answer cleanly.
- Is Basin A's flare count climbing while Basin B's holds flat, even though both report similar production growth?
- Did a count spike in one basin line up with a pipeline outage or curtailment event, or does it look like routine completions flaring?
- Are the largest flares concentrated in a handful of fields, or spread evenly across the basin?
None of this requires a precise emissions figure per flare. A nightly count and a rough size read is enough to spot which basin is burning more gas relative to its own baseline, and that relative read is usually what a regulator or fund analyst actually needs for a production-activity proxy.
Reading the trend, not the single night
One night of satellite passes will show cloud cover gaps, a flare that happened to be out for maintenance, or a false read from a different heat source. The trend across several weeks is the useful number. Build the comparison on a rolling count, not a single pass, and the basin-to-basin noise mostly cancels out. A basin that runs consistently higher counts over a month is telling you something about its flaring intensity that a single bad night of imagery would otherwise obscure.
This is also where cross-basin benchmarking earns its keep for ESG reporting. Fund analysts scoring portfolio companies on flaring intensity need a way to say "this operator's basin flares more than its neighbor's" without waiting on a quarterly filing that may already be six months stale by the time it's published. A nightly log, tracked across two or more basins side by side, turns that into a question you can answer this week instead of next quarter.
The practical setup is straightforward: define your monitoring areas, let the nightly passes build the count and size log for each one, and compare the trend lines over whatever window matters for your reporting cycle. Flare Monitoring runs exactly that nightly log across a monitoring area as a production-activity proxy, feeding into emissions reporting rather than replacing operator data with another unverified number.
If you're tracking flaring across more than one basin and want a consistent nightly count to compare them against, that's the gap this is built to fill.