What is associated gas, and why does it get flared instead of sold?
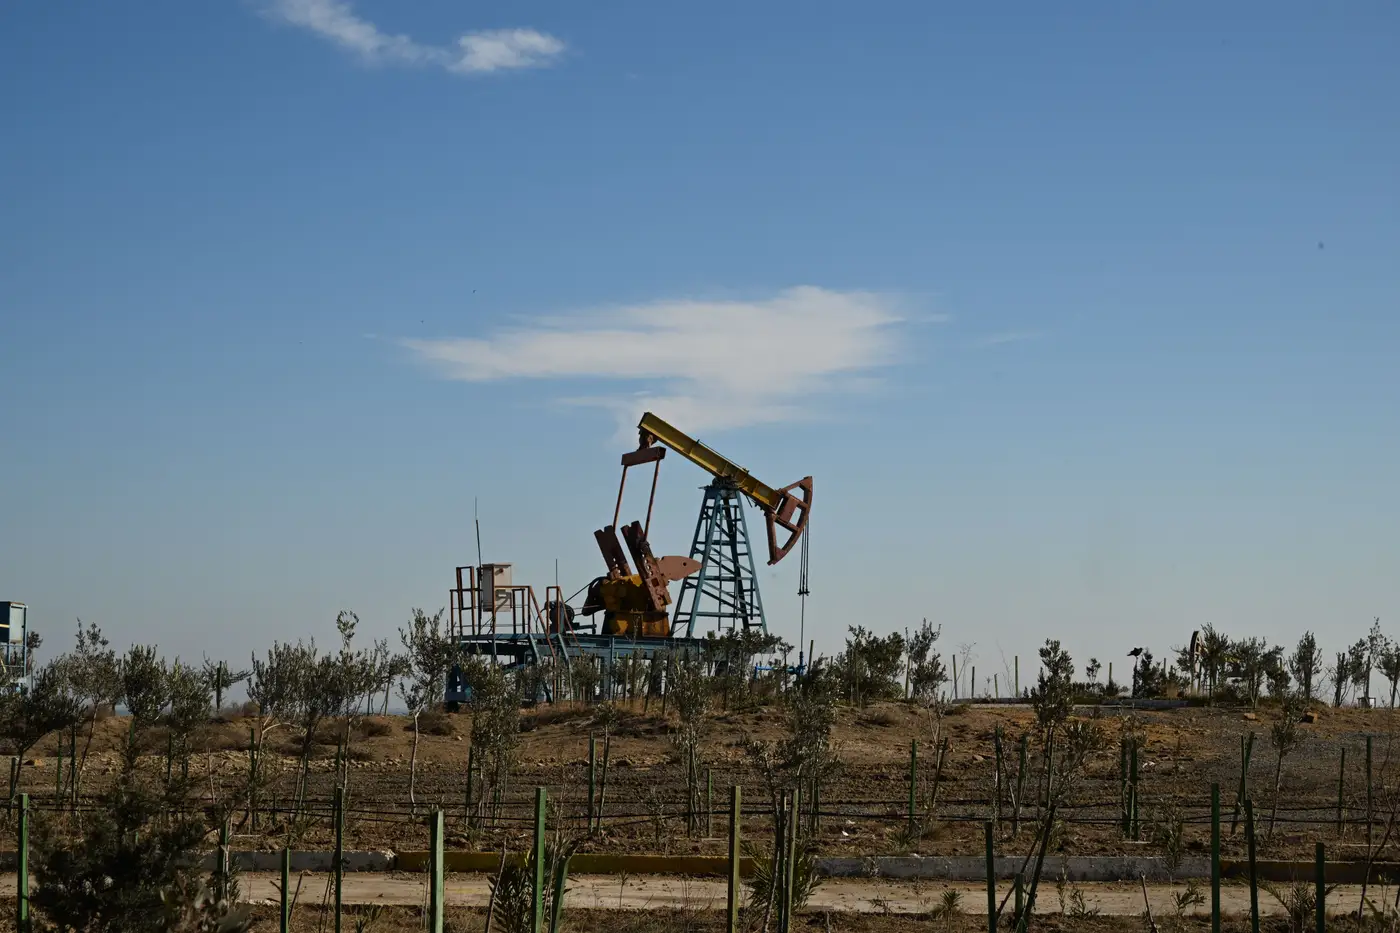
Associated gas is the natural gas that comes up with crude oil from the same reservoir. It isn't the target of the well. The target is oil, and the gas rides along, dissolved in the liquid at reservoir pressure until it separates out at the surface. That makes it different from gas produced from a dedicated gas well, where the gas itself is the product the lease was drilled for.
Gas-to-oil ratio and why it climbs
The amount of associated gas per barrel of oil is called the gas-to-oil ratio, or GOR. Every well has one, and it's rarely constant. As a reservoir depletes and pressure drops, GOR tends to rise, so a field that produced mostly oil with a trickle of gas in year one can be producing a lot more gas per barrel by year five. That shift matters because it changes the economics of what to do with the gas, and it's one reason flaring volumes at a field can increase even as oil output flattens or declines. A rising flare count at a mature field is often a GOR story before it's anything else.
Why operators flare instead of selling
Selling gas requires a buyer and a way to get the gas to that buyer: gathering lines, compression, dehydration, processing, and usually a pipeline connection to a trading hub. Building that infrastructure takes capital and years of lead time. In a new or remote play, the oil wells often come online long before any of that gas infrastructure exists, so operators are left with gas they can't move.
In practice, "stranded gas" describes gas with no economic route to market given current pipeline capacity and local price spreads. The gas is usually worth something somewhere; it just doesn't pencil out to move it off that particular lease. The Permian is the textbook case. Oil takeaway capacity got built out faster than gas takeaway, and during stretches when local gas prices went negative, it cost operators money to move gas off the lease even if a buyer existed elsewhere. Flaring became the cheaper option because the gas had no value at that wellhead on that day, whatever it might fetch somewhere else on the system.
Separate from this is safety flaring, which covers short bursts during well testing, upsets, or maintenance and isn't really a production signal at all. Regulators generally distinguish this from the routine, day-after-day burning tied to GOR and takeaway constraints. The World Bank's Global Gas Flaring Reduction partnership tracks the routine kind specifically because it's the kind that's avoidable with enough pipeline and processing investment, and it's the kind most associated with a Zero Routine Flaring target.
Why this matters for the numbers you're working from
Most flaring volumes that show up in regulatory filings and company sustainability reports are estimated, not metered. Operators report based on engineering calculations or spot checks, and the reporting cadence is often monthly or quarterly rather than continuous. For a regulator checking compliance or an ESG analyst trying to size Scope 1 emissions and reconcile them against reported oil output, that leaves a gap between what's disclosed and what's actually burning at a given site on a given night.
A nightly count of flare locations and relative size, pulled independently of operator reporting, closes part of that gap. It won't tell you the exact volume in standard cubic feet. It will tell you whether a site reported as shut-in is still lit, whether a new burn has started where no permit exists, and whether the pattern tracks production the way the filings claim. That's the basis of the nightly flare log Flare Monitoring builds from night-time and SWIR satellite imagery, which exists specifically as a check against self-reported volumes rather than a replacement for them.
If you're trying to track associated gas flaring against what operators are disclosing, that's a reasonable place to start comparing notes.