A nightly flare log for your monitoring area.
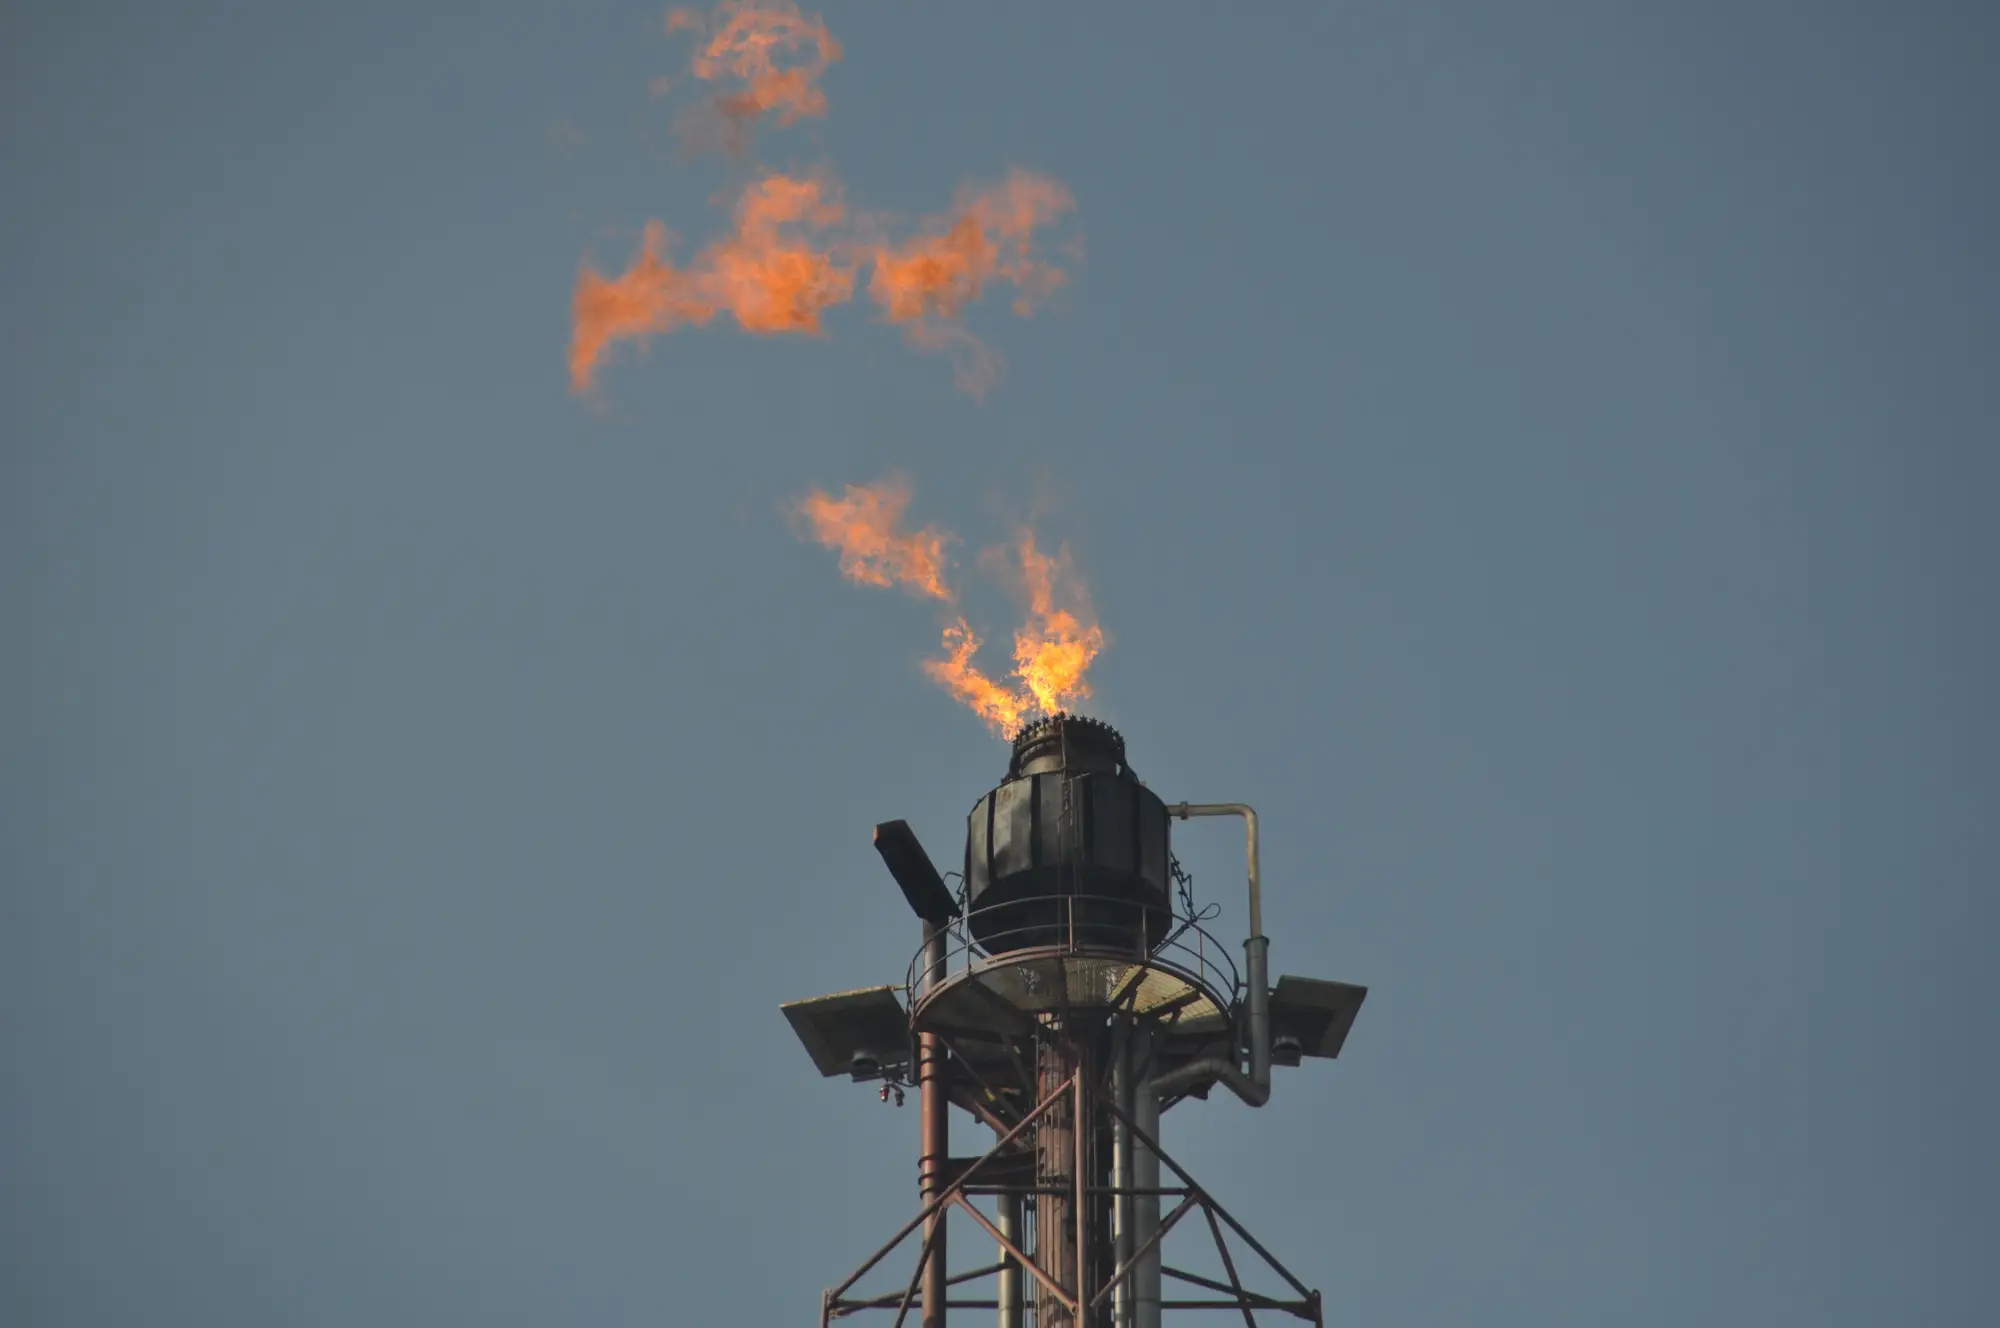
Night-time and SWIR imagery, read as a proxy for flaring activity and an input to emissions reporting, to set beside operator filings.
Spec sheet
- GSD
- Coarse, 250 m or coarser
- Cadence
- Nightly
- Platform
- Coarse-resolution satellite
- Spectral
- Thermal, no fixed spectral band
- Output
- Nightly log per site, active, inactive or unobserved
- Size
- Relative proxy, not a metered volume
The files
- Line
- 01
- File
Nightly flare log
- Format
CSV- What's in it
- One row per site per night with a status of active, inactive or unobserved. Arrives each night after the overpass. It opens in a spreadsheet, a GIS or a warehouse table, and it is the file you compare against the operator's register.
- Line
- 02
- File
Flare size estimate
- Format
CSV column- What's in it
- A relative size read for each active flare, taken from its thermal signature. Use it to rank and trend flares against each other. It is a proxy, so it is never a metered or calibrated gas volume and the delivery says so in the column header.
- Line
- 03
- File
Site time series
- Format
CSV and chart- What's in it
- Flaring activity per site over the nights covered, with unobserved nights left as gaps. Use it to see whether a stack that a filing calls quiet was in fact lit, and whether the pattern matches output.
- Line
- 04
- File
Reporting export
- Format
CSV- What's in it
- The log cut to your reporting period and your site list, for the audit file or the screening note.
How it works
01You supply
Define the area
You supply a monitoring area or an asset list, as a boundary in a shapefile or GeoPackage or as site coordinates.
02We do
Nightly pass
The area is read from a night-time thermal pass each night. SWIR and thermal radiance pick out burning flares from the dark ground around them.
03We do
Detect and size
Flares are detected and given a relative size from their signature. A clear night with nothing seen is logged inactive. A night with no usable view is logged unobserved.
04Comes back
Delivery
The nightly log and the running time series come back in the formats above.
Limits
These are the conditions that change what the log can tell you.
- Cloud
- Dense cloud can hide a thermal signature, even at night. Those nights are logged unobserved. They are never counted as inactive.
- Resolution
- At 250 m or coarser, a pixel is wider than a flare stack and wider than many whole well pads. The log places a flare at site level. It does not give a stack position, and two stacks on one pad read as one site.
- Size is a proxy
- The size estimate follows the thermal signature. It does not know the gas composition, the flow rate or how completely the gas burned, so it cannot be turned into a volume or an emissions figure on its own.
- Nightly, not continuous
- Each site is read at the overpass, not around the clock. A flare lit and put out between passes is not seen.
- What a lit flare is not
- A burning flare is a sign of activity. It is not proof of production, a violation or a leak, and the log never says it is.
Why the flaring return needs a second source
The operator reports what it flared. Where the gas is not metered, that report is an estimate made by the party being checked. Regulators accept this where metering is impractical, so the audit often ends up comparing a filing with last year's filing. A public satellite product helps, but it is built on its own grid, not on your licences or your asset list. The cost shows when a return looks low for a field whose output has not fallen and nobody can say whether the stack was lit.
Who it's for
For
- Regulators who audit operator flaring and venting returns and want an independent record by site.
- ESG fund analysts who screen issuers on flaring and want a nightly series to read against company reports.
- Analysts who take a log into their own GIS, spreadsheet or screening model.
Not for
- Teams that need a metered or calibrated gas volume.
- Methane leak or venting detection. This sees burning flares only.
- Live alarms. The log is nightly, with no continuous feed.
- Stack-level positions or engineering surveys of a single flare.
Questions from reviewers
Q1Is the size estimate a real gas volume?
No. It is a proxy from the thermal signature. Use it to rank and trend flares, not to report a volume.
Q2What happens on a cloudy night?
The site is logged unobserved. It is never filled in as active or inactive.
Q3How precise is the location?
Site level. At 250 m or coarser the log cannot give an exact stack position.
Q4Is it continuous?
No. It is nightly, tied to the overpass.
Q5Can we check it against our own records?
Yes. Each row carries the night and the site, so it lines up against a filed register or a field inspection. Tell us what you hold when the area is scoped and the comparison can be set up with you.
Q6Can it feed our GIS or screening model?
The log is a flat file keyed on site and night, so it loads into a GIS, a spreadsheet or a warehouse table.
Q7Who owns the log we receive?
Use and ownership terms for the delivered files are written into the contract before work starts.
Q8How is it priced?
Each monitoring area is scoped and quoted on its own. Send the area and a project team will come back with a written scope.
Send the area and we will tell you what the nightly log would cover.
Or ask in the .