What is GGFR, and how do satellite counts feed its reporting?
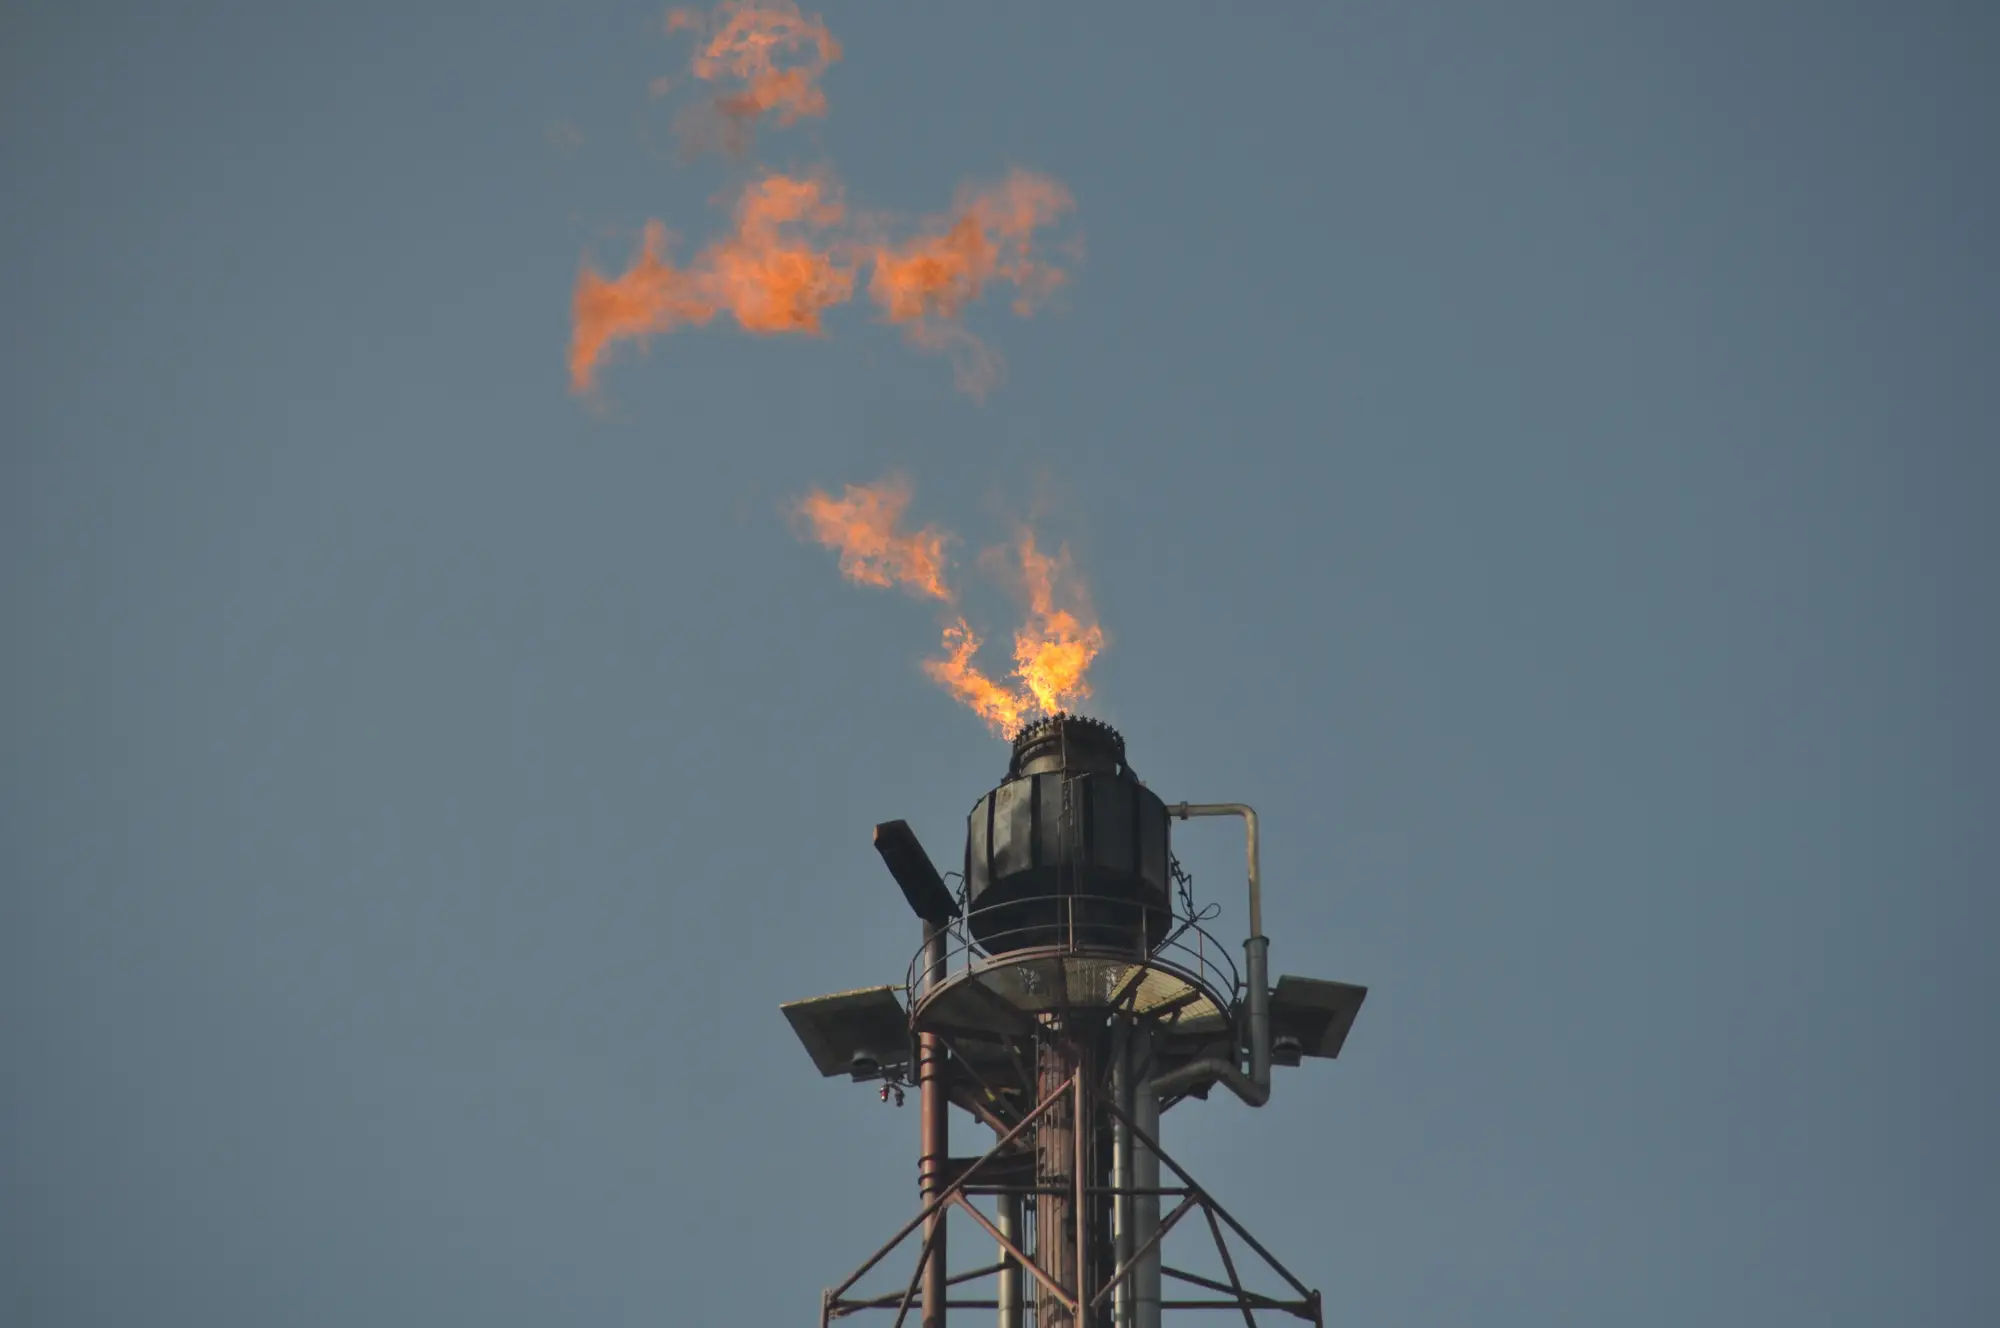
If you work in flaring compliance or ESG fund due diligence, you've run into the Global Gas Flaring Reduction Partnership sooner or later, usually as a footnote citing "GGFR estimates" in a country's emissions profile or a company's sustainability report. It's worth knowing what that footnote represents, because the number behind it travels a longer road than most people assume before it lands on your desk.
GGFR is a World Bank-led partnership of governments, oil companies, and development institutions set up to work toward ending routine gas flaring at oil production sites. Its best-known public output is an annual global flaring tracker, which estimates flared gas volumes by country and, for many producers, by operator. Regulators cite it when setting national targets. ESG analysts cite it when scoring a portfolio company's flaring intensity against peers, because it's often the only consistent, third-party figure available across jurisdictions that don't publish their own flaring data.
How a satellite pass becomes a flaring estimate
The tracker is built from night-time satellite imagery, primarily data from the VIIRS instrument flown on US polar-orbiting satellites, processed through flare-detection algorithms developed with Colorado School of Mines. Each sensor pass over a producing region picks up the infrared signature of combustion, and analysts match those detections to known well pads, gathering stations, and production facilities to assign the volume to a specific site, company, and country.
That process is thorough, but it runs on an annual cycle. A year's worth of satellite passes gets compiled, cross-checked, and published roughly a year after the fact, sometimes longer for regions with sparse ground-truth data. So the GGFR number you're citing in a Q1 report is typically describing flaring activity from two calendar years back. For a global, country-level estimate that's a reasonable trade-off. For anyone trying to catch a flaring spike at a specific field while it's still happening, or trying to verify what an operator told you last quarter against what was burning, it's a blind spot.
Where operator self-reporting and satellite reporting start to disagree
This is the part regulators and fund analysts both run into eventually. Operators file their own flaring volumes, often estimated from meter readings or engineering calculations rather than direct measurement, and those figures don't always line up with what satellites catch burning at the stack. A facility under a flaring reduction order has an obvious incentive to report the lower number. A field with intermittent flaring from well testing or unplanned shutdowns might not show up in a self-report at all if nobody's tracking it closely that month.
GGFR's annual tracker is a global accounting exercise, built for yearly country-level reporting, not a compliance tool for watching one monitoring area in near-real time. A nightly read on which flares are lit, roughly how large they are, and whether a site that reported "flaring ceased" is still showing a thermal signature needs a cadence the annual tracker doesn't offer and was never designed to offer.
That's the gap a nightly flare log is built to sit in. Flare Monitoring counts and sizes flares across a monitoring area every night, built from night-time and SWIR satellite imagery, feeding a running proxy for production activity that sits alongside operator filings rather than inside GGFR's publication cycle. A regulator can check last night's count against what an operator reported for the same week. A fund analyst can see whether a site that claimed "flaring ceased" months ago is still carrying a thermal signature tonight, long before the next annual tracker update would surface the discrepancy.
For a regulator building a flaring reduction case or a fund analyst trying to score a holding's emissions trajectory before the next annual tracker drops, that gap between what's self-reported and what's visible overhead tonight is exactly where an independent count earns its keep. If a nightly flare read sounds like the missing piece in your reporting cycle, that's the problem Flare Monitoring is built around.