What is flaring intensity, and how is it calculated per barrel of oil equivalent?
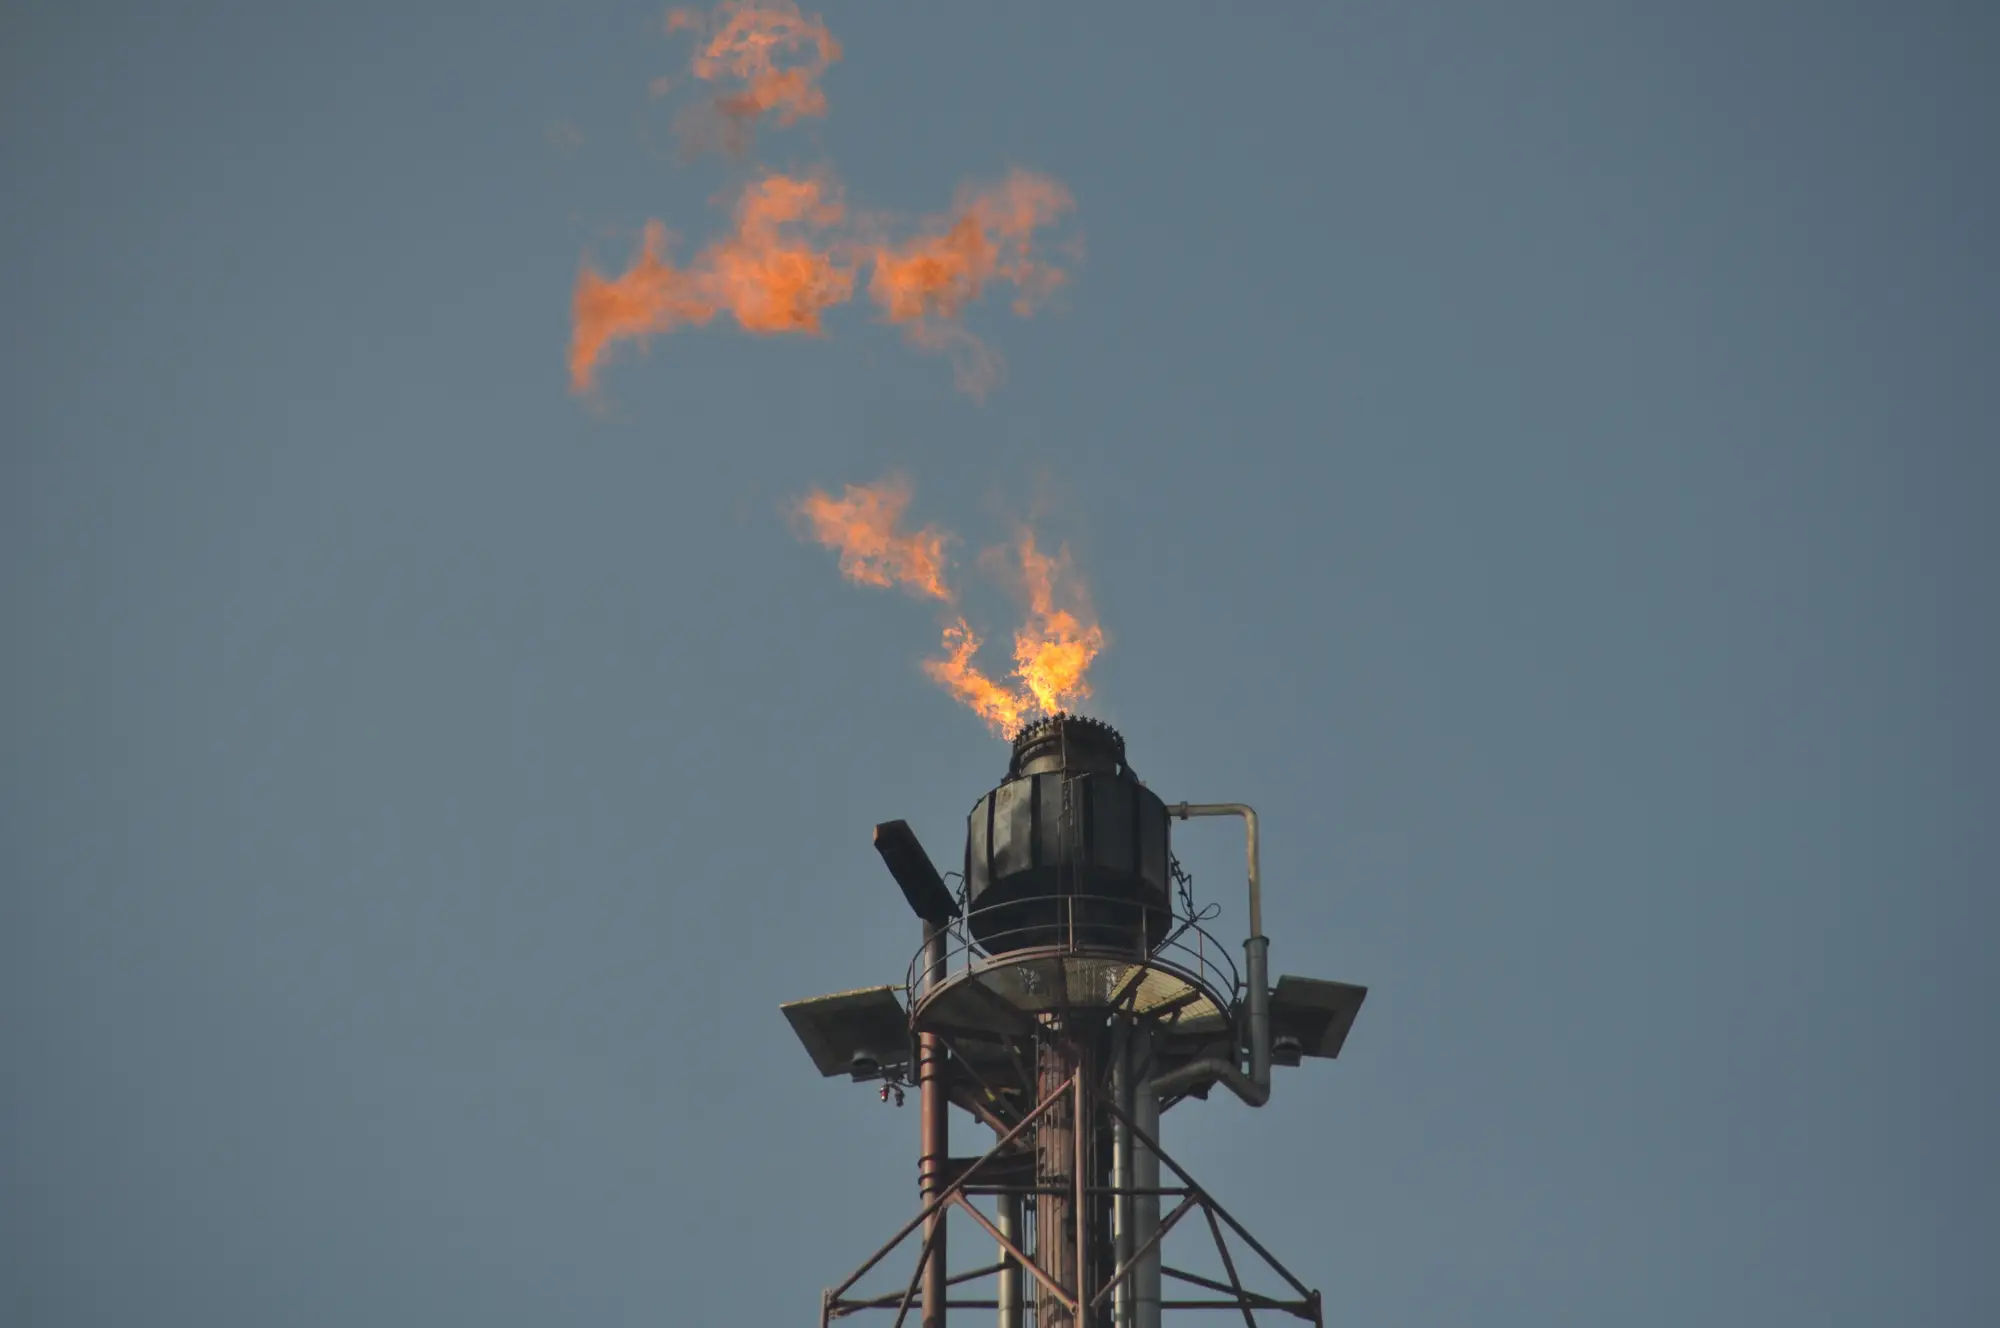
Flaring intensity is the ratio of gas flared to oil produced at a field, operator, or country level, usually stated as cubic meters flared per barrel of oil equivalent (m³/boe). Some older U.S. filings still use thousand standard cubic feet per barrel (mcf/bbl). Either way, it's the number the World Bank's Global Gas Flaring Reduction partnership built its country rankings on, and it's the figure ESG teams reach for when a company's Scope 1 disclosure is thin, stale, or missing a basin altogether.
The formula itself isn't the hard part:
Flaring intensity = volume of gas flared (standard units) ÷ volume of oil or oil-equivalent produced (BOE)
A field producing 10,000 bbl/day and flaring 50,000 m³/day of associated gas has a flaring intensity of 5 m³/bbl. Compare that to a field running at 0.5 m³/bbl and you've got a ten-fold gap in how much gas is being burned off per unit of oil extracted. That's the whole point of the ratio: it normalizes flaring volume against output, so you can compare a small marginal field against a supermajor's flagship asset without the raw volumes being meaningless.
Where the numbers actually come from
This is where the ratio gets complicated, because both the numerator and the denominator depend on reporting that isn't standardized across jurisdictions.
Flared volume is usually self-reported by the operator to a national regulator, then aggregated into country totals by bodies like GGFR using a mix of operator data and satellite-derived estimates from VIIRS Nightfire, which detects the thermal signature of flares from orbit and converts detected radiant heat into an estimated flared volume. The two sources don't always match. A field can under-report flaring in its regulatory filing while the satellite record shows continuous flare activity all year. Production volume, the denominator, is also self-reported, and it moves with well decline curves, workovers, and shut-ins that don't always make it into the public record in real time.
So when you see a flaring intensity number in a sustainability report, a GGFR country table, or an ESG data vendor's dashboard, you're looking at a ratio built on two inputs that are both subject to lag, rounding, and selective disclosure. The math is clean. The inputs frequently aren't.
Reading a flaring intensity ratio without getting fooled by it
A few things worth checking before you treat a flaring intensity figure as settled:
- Is the denominator oil only, or oil equivalent? Some operators quote intensity against liquids production alone, which inflates the ratio for gas-heavy fields and deflates it for oil-dominant ones. Confirm which base the number uses before comparing two assets.
- What's the reporting period? Annual averages smooth over months where a field flared heavily during a gas plant outage or pipeline tie-in delay. A flare event that ran for six weeks can vanish into a twelve-month average.
- Is the flared volume measured, metered, or estimated? Metered flare gas volumes are more reliable than engineering estimates based on choke settings, and satellite-based volume estimates carry their own error bars tied to flare temperature and cloud cover.
None of this means the ratio is useless. Flaring intensity is still the cleanest single number for comparing waste-to-production across fields and countries, and it's embedded in enough regulatory frameworks (World Bank GGFR reporting, several national upstream flaring rules, a growing number of ESG fund screening criteria) that it isn't going away. It just means the number deserves the same scrutiny you'd give any self-reported production figure, because it's built from the same source.
That's also the gap a nightly satellite read on flare counts and flare size is built to fill: it gives you an independent observation to sit next to the operator's filed intensity ratio, rather than taking the self-reported numerator on faith. You can get a feel for what that log looks like on Flare Monitoring's home page.
If you're tracking flaring intensity for a portfolio or a regulatory filing cycle and want a flare count that doesn't depend on the operator's own reporting calendar, that's the gap worth closing next.